Segmented reports
:format(png)/f/288714721386412/9a8d1e9b09/segmented-reports-hero.png)
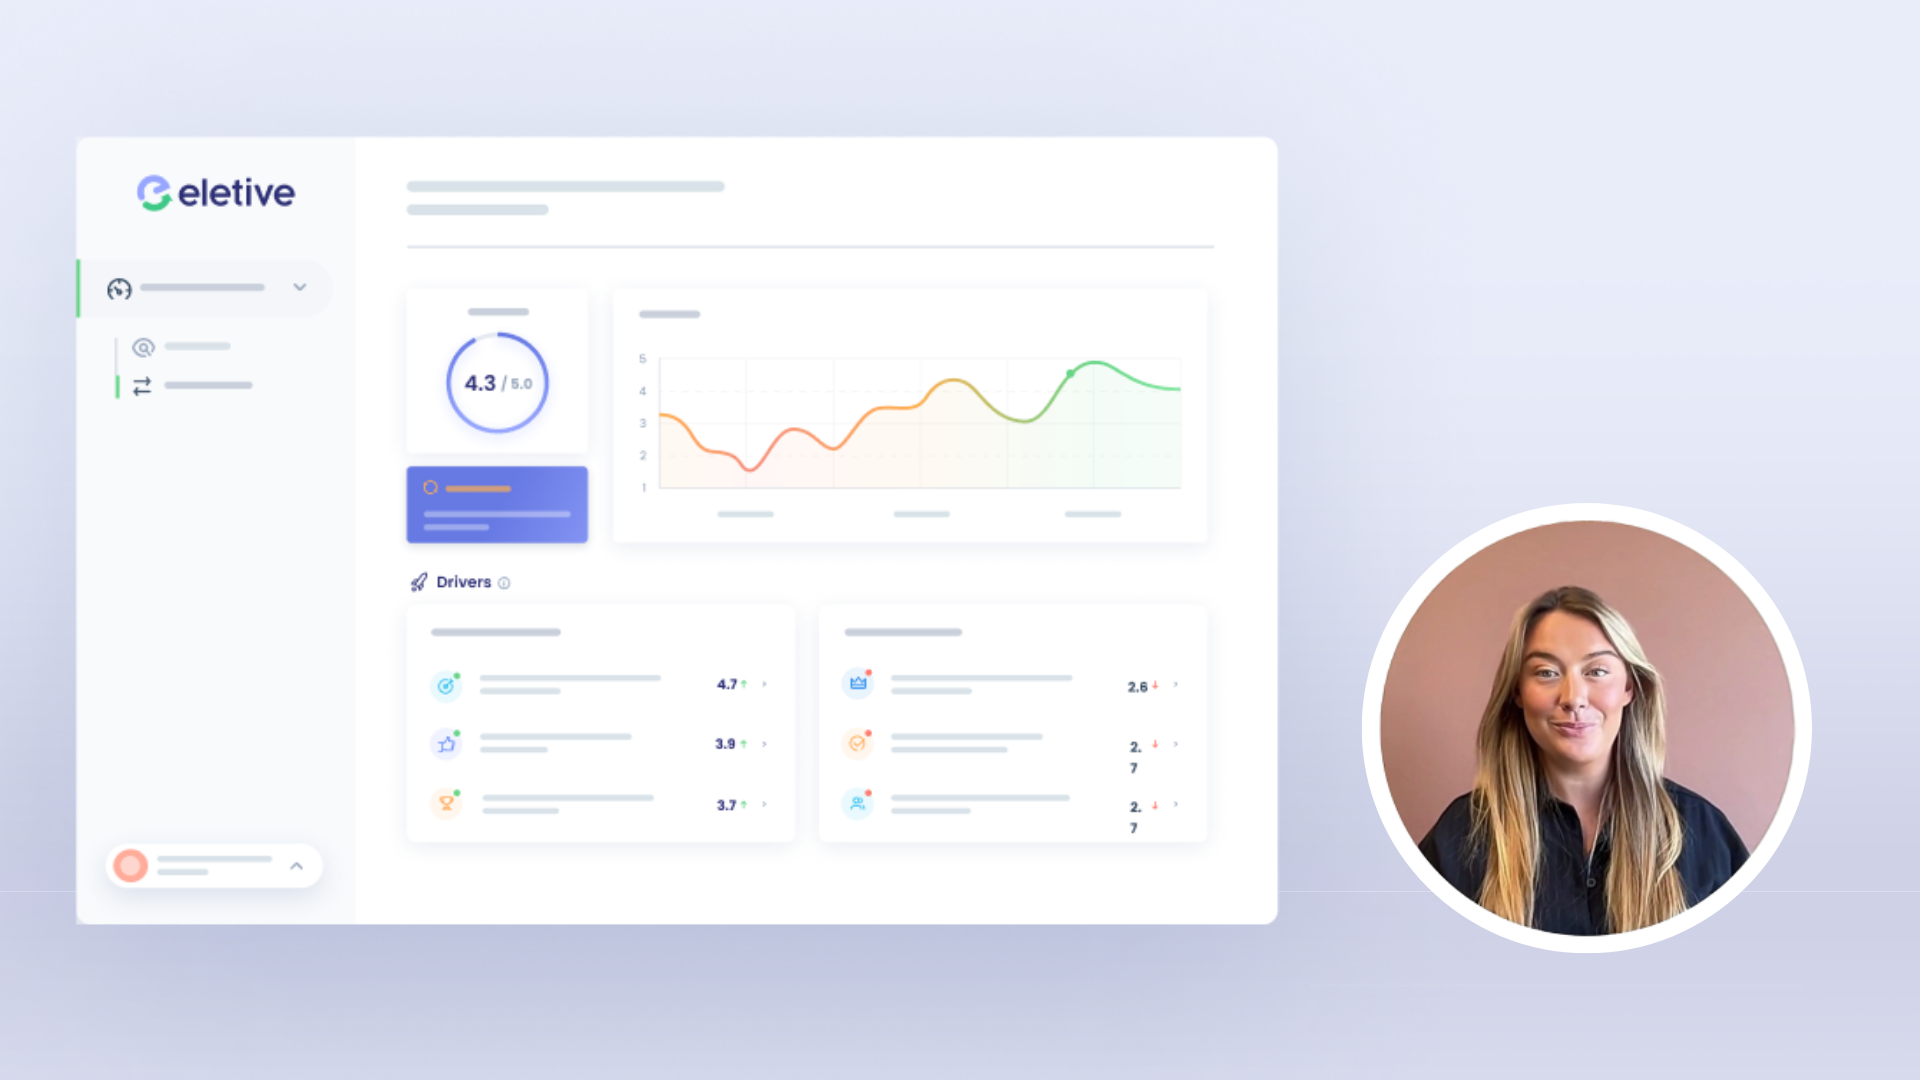
With segmented reports, you can slice and dice your employee engagement data based on factors like team, country, or gender.
Understand your data at a deeper level
Segmenting your data allows you to understand the dynamics of your organisation in depth. Now you can compare different teams, departments, and countries, as well as different demographics such as age or gender. This means you can quickly identify what areas are working well, and where extra attention might be needed.
Visualise the results in intuitive heat maps
Heatmaps, where you can filter the data based on segments, gives you an instant overview of your whole organisation. The heatmap is a great tool for immediately spotting where the organisation needs support and what it needs support with.
Examples of segments:
Country
Department
Team
Employment date
Gender
Age
Seniority
FAQ
How does segmenting employee engagement data help to gain a deeper understanding of the organisation?
Segmenting employee engagement data allows you to understand the dynamics of your organisation in depth. Now you can compare different teams, departments, and countries, as well as different demographics such as age or gender. This means you can quickly identify what areas are working well, and where extra attention might be needed.
What are some examples of segments that can be used when segmenting employee engagement data?
Examples of segments that can be used when segmenting employee engagement data include Country, Department, Team, Employment date, Gender, Age, and Seniority.
What benefits does segmenting employee engagement data provide?
Segmenting employee engagement data provides the benefit of being able to understand the dynamics of the organisation in depth, quickly identify what areas are working well, and identify areas that need extra attention.
How can segmented employee engagement reports help to identify areas of an organisation that need support?
Segmented employee engagement reports can help to identify areas of an organisation that need support by providing a visual representation of the data in the form of heat maps, which can be filtered based on segments. This allows for an instant overview of the whole organisation and quickly spots where the organisation needs support and what it needs support with.
Recommended reading
Discover how intelligent employee surveys can improve your people decisions...
Download >Explore the platform
We’d love to show you what Eletive can do for your organisation. Get in touch to schedule a free demo, tailored to your specific industry.


