The Chief Financial Officer, once seen as the gatekeeper of a company's finances, has moved beyond traditional roles. Today, they play a crucial part in aligning finance and HR. By understanding the overall business performance and the correlation to the employees can be a strong competitive edge.
In this context, Eletive emerges as a critical asset in the CFO’s toolkit, offering insights into the heart of the organisation and its most valuable resource: its people.
If you are a CFO with a strategic focus, Eletive’s advanced analytics offer you a way to understand the current state of your organisation’s human capital, and predict its future performance.
By integrating Eletive’s engagement data with your existing Business Intelligence (BI) systems, you can unlock a holistic view of your organisation combining financial data with people insights.
Download the CFO Guide: Aligning HR and finance
Combine engagement data with your Business Intelligence System
In the fast-paced business world of today, HR and Finance departments need to collaborate to achieve organisational goals and business metrics. By integrating systems, and creating correlations between financial data and employee engagement data fosters collaboration focused on aligning strategies, using data-driven insights, and optimising resources efficiently.
Let's explore how aligning HR and Finance can foster synergy, improve performance and drive business success.
Discover more about: Advanced People Management

Employee engagement impacts business metrics
Almost every part of an organisation involves people. The level of engagement among these people can greatly affect the business results. Gallup discovered that businesses with highly engaged employees see better business results than those with low engagement levels. In the following image you see multiple KPIs and how they are improved when organisations capitalise on engagement.

Engagement decreases employee cost-to-value
Engaged employees not only have longer tenures, they also reach their full productive potential faster. The difference illustrated in the chart represents a critical period during the ROI of new hires.
Decreasing the cost-to-value means accelerating the rate of return on human capital investments.
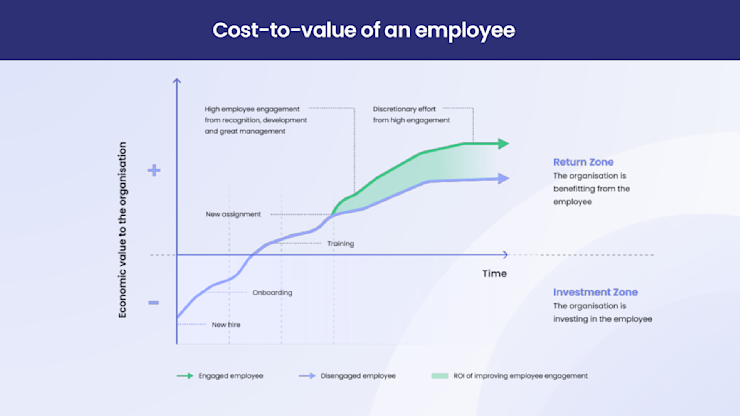
Hence, increasing employee engagement is important for both the HR-strategy, and financial reasons. It can help reduce costs related to training new employees and turnover. This can improve the financial health of the organisation and it's overall business performance.
How to analyse engagement data for strategic business insights
So how do you do it? Integration of employee engagement data with your (Business Intelligence) BI systems gives you a powerful lever for enhancing organisational performance.
In this part of the blog post, we have a closer look at how to conduct this analysis, what business metrics to look at, and how to draw conclusions related to employee engagement data.
Identify relevant business units
Before diving into the analysis, ensure Eletive or your employee engagement software is configured to reflect the structure of your organisation. This means identifying the specific business units that are critical to your operations. Consider the structure of your company: What are the key result units you wish to track?
Geographical locations
Departments
Stores
Warehouses
Select relevant business metrics
The choice of business metrics for analysis will vary depending on your industry and organisation. Here are some of the critical KPIs you can analyse in relation to employee engagement levels:
Gross Profit Margin
Goal Fulfilment
Revenue per Full-Time Equivalent (FTE)
Profit per FTE
Output
Growth
Net Promoter Score (NPS)
Customer Acquisition Cost (CAC)
Employee Turnover
Sick leave
Apply your business KPIs to the engagement analysis
We will use Gross Profit Margin as the key performance indicator (KPI) in the following examples.
However, this KPI can be substituted with any relevant metric that aligns with your organisation’s goals. By examining the correlation between engagement levels within various business units and the KPIs of your choice, you will be able to uncover valuable insights. The key is to align these analyses with your strategic objectives.
The goal is not just to gather data, but to translate it into strategic action. By selecting the metrics for analysis that are most relevant to your organisation, you can harness the full power of employee engagement data.
How to analyse your HR data related to business performance outcomes
1. Correlation analysis: gross margin profit vs employee engagement
Conducting a basic correlation analysis between your strategic KPIs (like Gross Profit Margin) and employee engagement levels over time can provide valuable insights into workforce impact.
Look at employee involvement in different areas of your business and consider how this affects the key performance indicators you prioritise. Examine the level of involvement in various areas of your business. Consider how this impacts the key performance indicators you prioritise. This will help you uncover valuable insights on financial outcomes.
By employing statistical methods such as Pearson’s correlation, it becomes possible to quantitatively assess the relationship between these two critical metrics. In the example below, analysis of the Gross Profit Margin alongside engagement levels reveals a very strong positive correlation coefficient of 0.94.
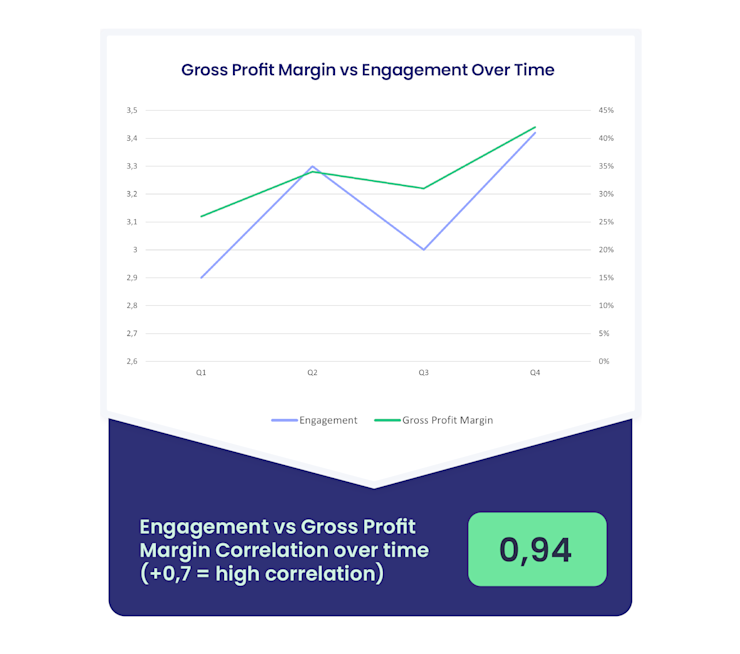
By understanding the relationship between engagement and financial performance, financial leaders can better forecast future profitability and make more informed strategic decisions.
2. Predictive Analysis: engagement as a leading indicator of business outcomes
Many studies have found a strong link between employee engagement and important business success factors. This means that engaged employees can directly impact the success of a business. Your employee engagement data is not only about employee satisfaction. It can also help predict future business performance.
As the CFO, you can use detailed engagement data to predict performance and make strategic decisions about which initiatives to prioritise and continue investing in.
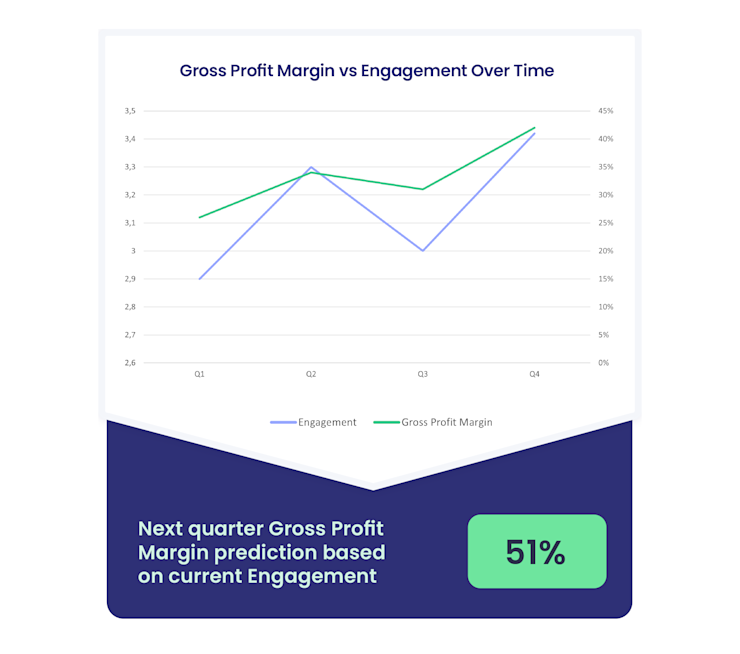
This allows for proactive adjustments in strategy and operations, aiming to enhance both employee satisfaction and financial outcomes. Financial leaders can use engagement data to predict changes in business metrics. They can then make data-driven decisions based on this information. These decisions can help drive the desired change within the organisation.
3. The financial impact of specific engagement drivers
Understanding the link between specific engagement drivers and strategic KPIs is essential for organisations looking to enhance their operational and financial performance.
Analysing correlation between engagement drivers and KPIs will help you pinpoint which aspects of employee engagement have the most impact on your bottom line.
These insights enable your organisation to prioritise improving the drivers that are most likely to influence financial outcomes positively.
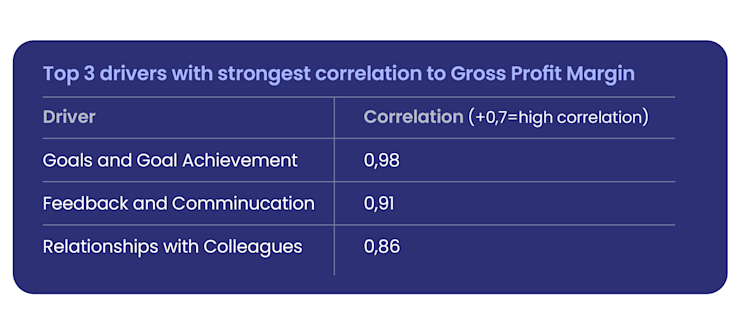
In the highlighted example, “Goals and Goal Achievement” emerges as the most crucial driver for enhancing Gross Profit Margin. By focusing on this area, this particular organisation can develop targeted initiatives aimed at improving goal-setting and achievement processes, thereby directly impacting their profitability.
An even more granular analysis can be conducted at the question level to identify the most impactful themes to address. By honing in on specific themes that strongly correlate with important KPIs, organisations can tailor their engagement strategies to maximise financial impact.
This strategic approach not only enhances employee satisfaction and morale but also drives significant improvements in organisational performance and financial health.
Segment your analysis for deeper insights
By dividing your organiaation into relevant business units, such as departments, teams, or geographic locations, you can analyae both engagement levels and key performance indicators (KPIs) within each segment more effectively.
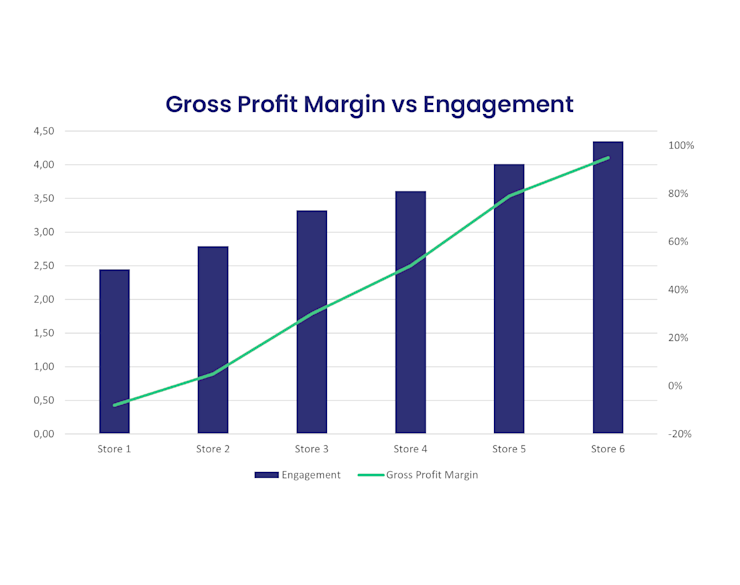
The graph shows both engagement levels (or specific engagement drivers/questions) and a chosen KPI for each business unit. You can sort the graph by either KPI values or engagement scores. This visual representation often highlights patterns or correlations that might not be obvious from numerical data alone.
Companies using Eletive often find that business units with higher engagement levels consistently perform better. Sorting the graph by KPI can also identify which business units are outliers, prompting a closer examination of unique factors within those units.
Organising data by engagement levels helps pinpoint areas where strategic actions could improve both engagement and KPI performance.
Remember, the goal of this analysis is not just to identify correlations but to unlock actionable insights. Engagement can be further broken down into specific drivers and questions, providing a deeper understanding of what influences these metrics.
eNPS vs NPS: The impact of engagement on customer satisfaction
Looking at the relation between your Employee Net Promoter Score (eNPS) and your NPS score provides valuable insights into the link between employee satisfaction and business performance.
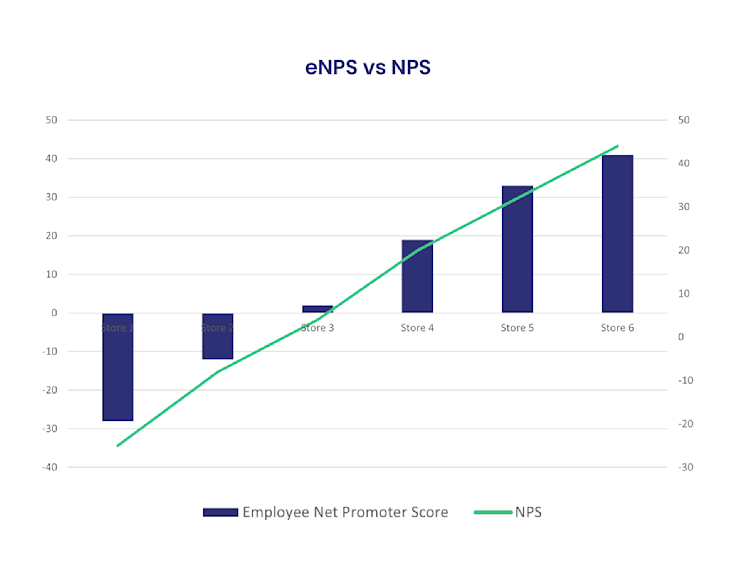
There is usually a clear correlation between happy employees and happy customers. The relevant data will help you attain both.
Engagement vs sick leave & absence rate
The relationship between employee engagement and sick leave & absence rates is an area where deeper analysis can provide valuable insights.
Companies often notice that higher engagement leads to lower absence rates, indicating that engaged employees are more satisfied, healthier, and more committed. This relationship is shown in the graph to the right.
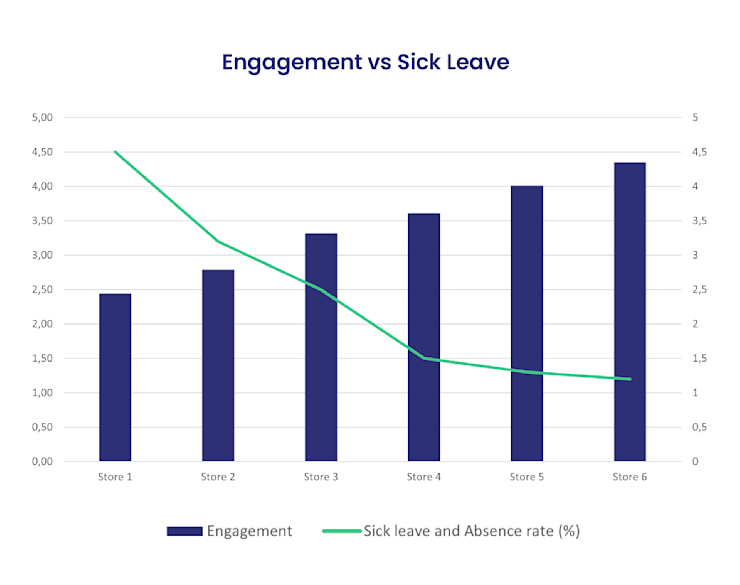
Eletive helps you not only identify this correlation but also understand the key drivers of engagement that impact sick leave in different areas of your organisation.
By using Eletive data, you can pinpoint specific areas for improvement, ensuring strategies effectively reduce absenteeism and enhance overall employee well-being.
Employee engagement vs Turnover rate
Exploring the link between employee engagement and turnover rates also provides key insights into your workforce stability. Generally, high levels of engagement are associated with reduced employee turnover. Engaged employees typically feel more connected and satisfied with their work environments.
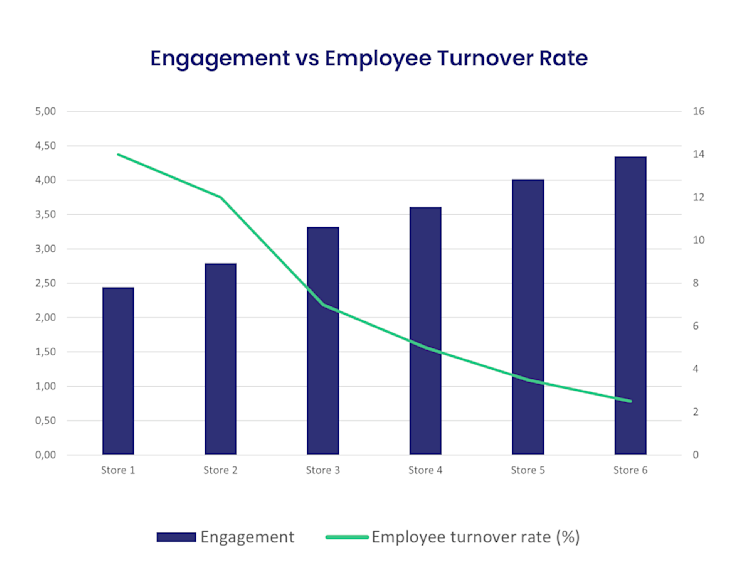
Eletive's advanced analytics help organisations see and understand how different factors affect employee turnover. They can pinpoint which engagement drivers have the biggest impact on turnover in different parts of the organisation.
By understanding these dynamics, companies can implement targeted interventions aimed at boosting engagement. Thus decreasing turnover and fostering a more loyal and stable workforce.
Make engagement your competitive edge
In conclusion, aligning HR and Finance is not just about operational efficiency but also about strategic alignment and organisational effectiveness. When these departments collaborate, organisations can benefit from their strengths.
Discover how Eletive supports Rusta on their growth journey
This collaboration also helps to reduce risks. Ultimately, it enables organisations to achieve long-term growth in a competitive market. In today's economy, businesses need to integrate HR and Finance to be successful and stand out.
To learn more about how HR and Finance can work together for success, check out Eletive's library. Strategic collaboration can improve your business results. Accessing Eletive's engagement data is just as important as tracking other key business indicators.
Happy employees lead to lower turnover costs, happier customers, and increased productivity, all essential for a company's success.
Using this data in financial strategies is now a crucial aspect of modern financial leadership. It helps to equip leaders with the tools they need to make informed decisions.
Eletive: Your catalyst for engagement ROI
Eletive enables organisations to track and improve engagement in real time. This is not just about improving the workplace, but also about using engagement to increase profits.
Calculate the ROI of your potential engagement initiatives
McKinsey research indicates that disengagement and attrition can be costly for a medium-sized S&P 500 company. The financial impact is clear, with potential losses amounting to $355 million annually.
Corporate leaders first have to grasp that their workforces are not monolithic when it comes to employee experience and that the tactics to increase performance require a more segmented approach. Leaders can then apply differentiated strategies to groups of employees that boost levels of satisfaction and commitment, performance, well-being, and, ultimately, retention and engagement.
- Aaron De Smet, Marino Mugayar-Baldocchi, Angelika Reich, and Bill Schaninger, McKinsey, 2023
Simply put, one solution does not work for everyone when it comes to addressing the complex experiences of employees. The ROI of improving engagement is realised through segmented, targeted strategies that elevate satisfaction, commitment, and performance, leading to better retention and engagement. This is exactly what Eletive helps you achieve.
Eletive – the People Success Platform
The Eletive platform includes everything an organisation needs to measure and improve employee engagement and performance. It’s a comprehensive platform that provides unprecedented abilities to gain insights and take action to improve business outcomes.

• Intelligent, AI-powered employee surveys
• Advanced performance management and employee development • Advanced data management capabilities for deep insights • Support for global and complex organisations
Eletive is a modern platform for employee engagement and performance management, that helps you understand the state of engagement in your organisation - and what you can do to improve it. Book a demo to learn more!

Johanna is Content Manager at Eletive, where she juggles everything from blogging and social media to webinars and customer communications. She enjoys using digital marketing strategy and creative content marketing to help organisations build workplaces where people thrive.


